We’ve all been there – drowning in a sea of numbers, desperately trying to make sense of complex data. It’s frustrating, overwhelming, and can leave us feeling powerless. But what if I told you there’s a way to transform those confusing figures into clear, actionable insights? Welcome to the world of data analytics visualization tools.
In our digital age, data is the new gold. Every click, purchase, and interaction generates valuable information. But raw data is just noise without the right tools to interpret it. That’s where data visualization software comes in, turning abstract numbers into vivid, understandable stories.
Business intelligence (BI) tools have revolutionized how we perceive and use data. They’ve become the secret weapon of successful companies, helping them spot trends, predict outcomes, and make informed decisions. From startups to Fortune 500 companies, everyone’s tapping into the power of data visualization.
The global data visualization market is booming, expected to reach $19.20 billion by 2027. This growth is fueled by the increasing use of smartphones, advancements in machine learning, and the widespread adoption of cloud computing. As we navigate this data-driven landscape, understanding and leveraging these tools becomes not just an advantage, but a necessity.
Key Takeaways
- Data visualization transforms complex information into easy-to-understand visuals
- Business intelligence tools are crucial for informed decision-making
- The global data visualization market is projected to reach $19.20 billion by 2027
- Popular tools include Tableau, Microsoft Power BI, and Google Data Studio
- Key features to look for include data integration, real-time visualization, and interactivity
Understanding Data Visualization and Its Importance
Data visualization turns raw data into pictures, making it easier to see patterns and insights. In today’s world, businesses must use data tools well. Let’s explore data visualization and why it’s key for making decisions.
What is Data Visualization?
Data visualization shows data in pictures or graphs. It’s more than just charts and graphs. It includes heat maps, treemaps, and 3D plots. These tools make complex data easy to understand.
The Role of Data Visualization in Decision Making
Interactive data dashboards are crucial for making decisions today. They give real-time insights, helping businesses act fast. For example, in the U.S. digital ad industry, expected to hit $390 billion by 2027, data tools are key for tracking ads and returns.
Key Benefits of Data Visualization
Data storytelling platforms bring many benefits:
- Faster insights: 72% of organizations report quicker access to information
- Enhanced comparison: Easily identify trends, outliers, and patterns
- Improved methodology: Optimize data analysis processes
- Efficient data sharing: Communicate complex information effectively
- Time-saving: Quickly spot trends in large datasets
By using these benefits, businesses can make smart choices, avoid analysis paralysis, and stay competitive. As data grows, the need for good data visualization tools will too.
Types of Data Visualization Techniques

Data visualization techniques are key in visual analytics and data discovery. They turn complex data into visuals we can understand. Let’s look at some common types and how they’re used. Bar charts and line graphs are among the most widely used data visualization techniques for comparing trends and tracking changes over time. Scatter plots are another powerful tool, helping to identify relationships or correlations between variables. These data visualization techniques not only simplify information but also make insights more accessible to diverse audiences.
Bar charts are great for comparing categories and their values. They’re simple to use for basic analysis. Pie charts show parts of a whole, making it easy to see proportions.
Histograms and scatter plots are for more detailed analysis. Histograms show data spread, helping find patterns. Scatter plots show how variables relate, useful for big data.
Heat maps and choropleth maps are also used. Heat maps use color to show data changes. Choropleth maps use color to show data over maps. Both help spot trends fast.
| Visualization Type | Best Used For | Key Benefit |
|---|---|---|
| Bar Charts | Category Comparisons | Easy to interpret |
| Pie Charts | Part-to-Whole Relationships | Simplistic visual representation |
| Histograms | Data Distribution | Identifies patterns and outliers |
| Scatter Plots | Variable Relationships | Reveals correlations in large datasets |
| Heat Maps | Data Intensity | Quick trend identification |
| Choropleth Maps | Geographic Data | Visual representation of regional variations |
Using different data visualization techniques improves our data tools. The right technique depends on the data and what we want to find out.
Data Analytics Visualization Tools: An Overview
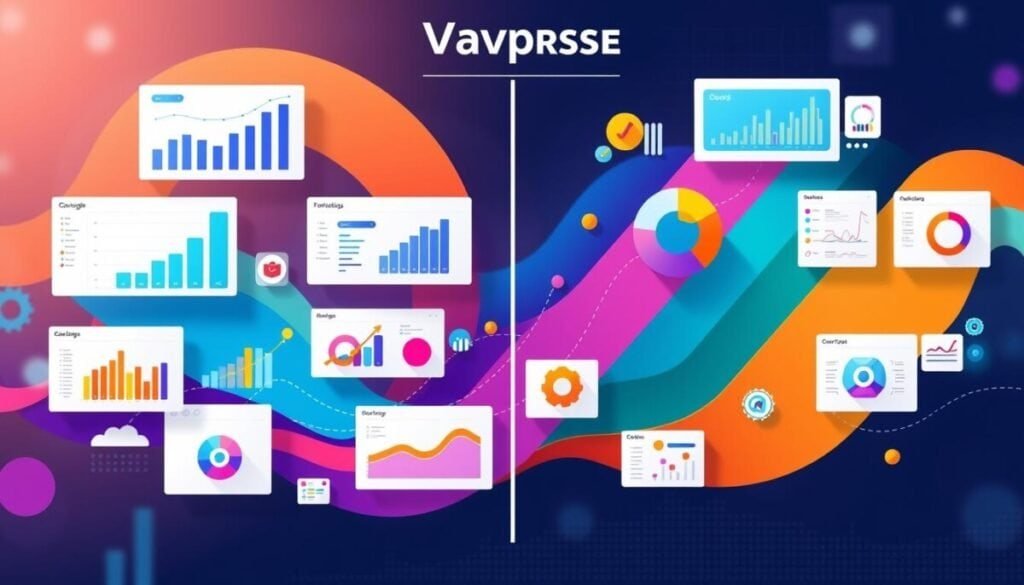
Data reporting and presentation tools are key for businesses to understand complex data. We’ll look at popular software, their features, and how to deploy them. This will help you pick the best tool for your needs.
Popular Data Visualization Software
The market has many data visualization tools for different needs and budgets. Here are some top choices:
- Tableau: Known for its user-friendly interface and powerful visualization capabilities
- Microsoft Power BI: Integrates seamlessly with other Microsoft products
- Google Charts: Free and easy to use for basic visualizations
- Yellowfin: Fast and powerful for complex, real-time visualizations
- Looker: Emphasizes real-time data exploration with robust security features
Key Features to Look for in Visualization Tools
When picking data presentation tools, look for these key features:
- User-friendliness: An easy-to-use interface
- Data handling capacity: Handling large datasets well
- Chart variety: Support for many visualization types
- Integration capabilities: Works well with different data sources
- Customization options: Can be tailored to your brand
Cloud-based vs. On-premise Solutions
Choosing between cloud-based and on-premise tools depends on your needs:
| Cloud-based | On-premise |
|---|---|
| Flexible access from anywhere | Greater control over data |
| Automatic updates and maintenance | Enhanced security for sensitive information |
| Scalable resources | Customizable infrastructure |
| Lower upfront costs | One-time licensing fee |
Understanding these aspects of data visualization tools helps you make a smart choice. It should match your organization’s goals and resources.
Top Data Visualization Tools in the Market

Data analytics visualization tools have changed how we understand complex data. In today’s world, these tools are key for turning raw data into useful insights. Let’s look at some top business intelligence (BI) tools that are leading the way. Some of the top BI tools include Tableau, Power BI, and Qlik. These tools allow organizations to create interactive and visually appealing dashboards, charts, and reports. In addition to these established tools, there are also several newer analytics tool options that are gaining traction in the market.
Tableau: Powerful and User-friendly
Tableau is a leader in data visualization. It works with many data sources and performs well. Its easy-to-use interface lets users make beautiful visualizations fast.
It’s no surprise that 72% of companies say they get insights faster with tools like Tableau.
Microsoft Power BI: Integrating with Microsoft Ecosystem
Power BI is great for businesses that use Microsoft tools. It has customizable dashboards and uses Microsoft AI for advanced analytics. Power BI’s tools make it easy for users to create reports.
Google Data Studio: Free and Google-integrated
Google Data Studio is free and works well with Google tools. It has many reporting templates for different needs. It’s perfect for businesses using Google’s tools, making data visualization easy.
Looker Studio: Deep Data Analysis Capabilities
Looker Studio is great for deep data analysis. It connects with many databases and has tools for quick insights. Looker works with over 50 SQL dialects, making it flexible for complex data needs.
When picking data analytics tools, think about ease of use, how well they handle data, and cost. The right BI tool can help your business make better decisions and stay ahead in the market.
Choosing the Right Data Visualization Tool for Your Needs

Choosing the right data visualization tool is key for good data analysis. We must think about several things to make a smart choice. Let’s look at the main points to remember when picking data exploration tools.
First, figure out what you need. Think about the types of charts you want, how much data you’ll handle, and your team’s skills. This helps you find tools that match your goals.
Then, check the tool’s features. Look for how easy it is to use, how much data it can handle, and if it integrates well with other tools. Interactive dashboards are great for exploring data, so choose tools with this feature.
| User Type | Preferred Tool Type | Percentage |
|---|---|---|
| Data Analysts and Scientists | Visual Analytics Tools | 70% |
| Business Users and Consultants | Data Storytelling Tools | 60% |
| Journalists and Marketing Professionals | Independent Visualization Tools | 80% |
Also, think about the tool’s growth potential and support for live data. These are important for companies that are growing or dealing with fast-changing data. Look at how easy it is to learn and the support available to make sure your team can use it well.
Finally, consider the cost. Some tools offer free trials or limited versions, so you can try them before buying. By carefully looking at these points, you can pick a data visualization tool that meets your needs and improves your data exploration.
Future Trends in Data Analytics and Visualization
We’re seeing a big change in how we look at data. Augmented and virtual reality are changing how we interact with it. These technologies let us dive into our data, giving us new views and insights.
Real-time tools are becoming more common. They meet our need for quick insights in today’s fast world.
Artificial Intelligence and Machine Learning are changing data visualization. They help us understand complex data better. Data storytelling platforms are also growing. They let us tell stories with our data, making it easier for everyone to understand.
More people are using smartphones for data analysis. This means mobile-friendly visualizations are becoming key. It’s all about making data accessible to everyone in an organization. Now, we’re also focusing on making sure data is shown fairly and responsibly.
