Can a creator turn raw view numbers into a steady growth engine for their channel in 2026? We believe data literacy is the superpower that answers that question.
With over 2.7 billion active users on the platform and more than 50 billion daily views from short-form clips, understanding how each video performs has never mattered more to us.
In this short guide, we show how to track views, likes, comments, and shares so you can read watch time and retention signals clearly.
We also explain average view duration and percentage so your shorts feed decisions stay competitive. Along the way, we link to a practical view delays guide that helps when numbers lag.
Our goal is to help you turn insights into lasting growth without drowning in numbers.
Key Takeaways
- Data literacy matters: mastering core metrics transforms content decisions.
- Track views, likes, comments, shares, and watch time consistently.
- Use average view duration and percentage to improve retention and pacing.
- Expect some reporting delays; check verified guidance when counts stall.
- Translate insights into a repeatable strategy to grow subscribers and views.
Moving Beyond Vanity Metrics in YouTube Studio
The dashboard can feel like a blink-and-you-miss-it reward system that keeps us hooked instead of informed. We often find that YouTube Studio acts like a dopamine slot machine, distracting us from the metrics that actually drive channel growth.
We stop chasing raw views and instead track the time-based signals that predict long-term performance. Retention and engagement tell us if a video holds our audience and earns returning subscribers.
By studying audience behavior, we refine content and pacing so videos resonate more deeply. That means focusing on average watch time, swipe patterns, and where viewers drop off.
Actionable insights are different from surface-level numbers. When we ignore the dashboard noise, we can craft a clear strategy that improves comments, likes, and subscriber growth over time.
- Prioritize retention over total views.
- Use time-based data to improve pacing and hooks.
- Measure engagement that predicts repeat viewers and subscribers.
Essential YouTube Shorts Analytics Tools for Creators

C
The right dashboard makes spotting winning content and patterns fast and simple.
We choose software that turns raw numbers into action. Good platforms show which videos earn views, likes, and watch time at a glance.
We recommend two options that fit different budgets and needs.
Choosing the Right Software
Lenos YouTube Video Analytics Checker is 100% free and has an intuitive interface. It simplifies complex video performance data so we can act quickly.
Integrating Third-Party Dashboards
Viraly gives a deep view with 18+ metrics per video. By combining these dashboards, we track engagement and watch time better than studio reports alone.
These platforms help us compare new uploads to past videos. That keeps our strategy data-driven and focused on growth.
| Platform | Key Strength | Best For |
|---|---|---|
| Lenos | Free, easy interface | Creators starting out |
| Viraly | 18+ metrics, deep insights | Channels needing detailed performance data |
| YouTube Studio | Built-in reports, immediate access | Quick checks and official data |
Mastering the Holy Trinity of Shorts Metrics
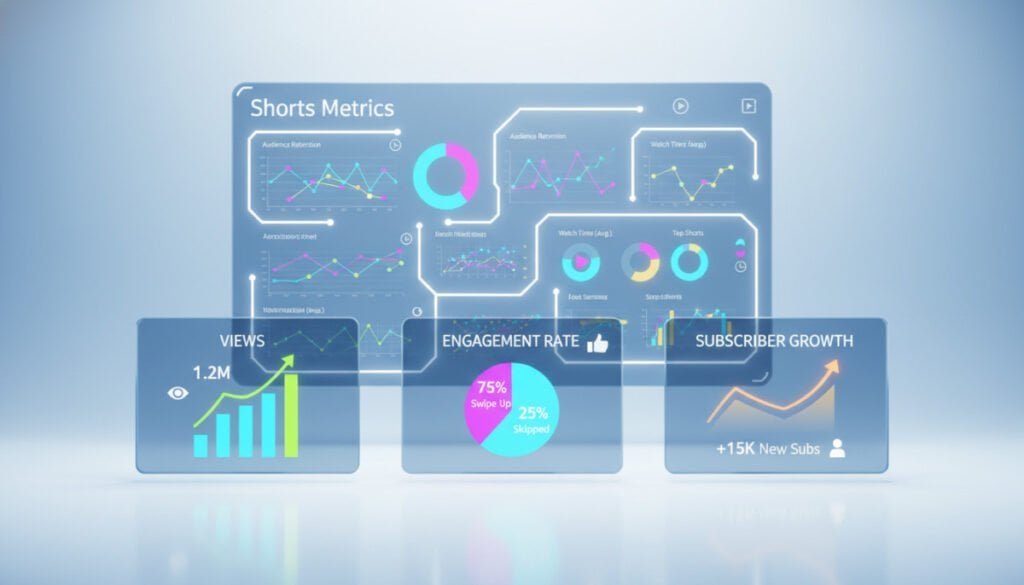
We track a trio of metrics that tell us if content earns distribution and repeat attention. These three numbers give a clear signal about a video’s health and whether our channel will grow.
The Swipe-Away Rate
Swipe-away rate shows how often viewers leave within the first seconds. Keep the viewed percentage above 70% to maintain distribution.
That threshold helps the algorithm keep our clips in the feed and drives more views and likes.
Average Percentage Viewed
Average Percentage Viewed (APV) measures how much of a video people watch. For a 60-second video we aim for >90% APV.
For a 15-second clip the benchmark is even higher — over 130% — which signals rewatches and strong retention.
Returning Viewers
Returning viewers prove our channel builds loyalty, not just one-off attention. We watch this metric to see if videos convert casual viewers into subscribers.
By tracking these video analytics and average view duration, we find retention drops and fix pacing to improve performance.
- Why it matters: These metrics directly affect our shorts feed presence and total views.
- How we act: Test hooks, tweak pacing, and monitor changes.
When these three metrics move together, we turn shorts into a reliable engine for long-term channel success. For guidance when numbers lag, consult our view delays guide.
Analyzing Traffic Sources and Audience Behavior

We map where traffic lands on our channel to spot which discovery paths drive real engagement. Knowing whether views come from the shorts feed or from search changes how we craft each piece of content.
When viewers arrive via the feed, we prioritize stronger hooks and pacing. When search drives clicks, we sharpen titles and tags to match intent. Balancing feed-based views with search-based views builds a resilient channel that does not depend on a single source.
We also watch how audience behavior shifts across discovery channels. Suggested videos and external links produce different engagement patterns, so we tailor future videos to those signals.
Actionable insight: track where viewers find our videos and then adjust metadata, thumbnails, and content style. For delays or reporting gaps, check this view delays guide to confirm numbers before making big decisions.
Conducting a Performance Audit for Your Channel
Within 24 hours of release, we scan key signals to judge a video’s initial health. This quick audit tells us if our content met baseline expectations for retention and engagement.
The Twenty-Four Hour Review Workflow
We follow a simple, repeatable sequence so every video gets the same scrutiny. The process helps us catch issues early and make fast, data-driven edits.
- Confirm raw numbers: record the exact view and like counts at 24 hours to track momentum.
- Check watch time: compare average watch time to similar videos to judge pacing and edits.
- Measure retention: note the percentage of viewers who stayed past the hook and identify drop points.
- Assess engagement: read comments for intent signals and tally shares and saves when available.
- Decide next steps: iterate the edit, tweak the hook, or re-test the thumbnail and caption.
Why it matters: this disciplined review reveals whether our hook stopped the scroll in a crowded feed. It also pinpoints where to tighten cuts to boost watch time and retention.
| Metric | 24‑Hour Benchmark | Action If Below Benchmark |
|---|---|---|
| Views | Compare to channel median (first-day) | Boost distribution: repost, promote, or revise thumbnail |
| Average Watch Time | Within 10% of top recent videos | Tighten pacing, shorten intro, test faster cuts |
| Retention Percentage | Target >70% for full-segment retention | Rewrite hook, add early value, remove dead time |
| Likes & Engagement | Match top-performing videos’ like ratio | Encourage CTA, reply to comments, pin strong replies |
We also use a focused reference when numbers lag. For a full audit checklist, consult our channel audit guide. This routine keeps our video strategy adaptive and our channel moving forward.
Leveraging Competitive Intelligence for Growth
We study rival creators to spot repeatable formats that win attention fast.
Competitive intelligence helps us see which video structures, tags, and pacing perform best in our niche.
Using a professional tool for competitor analysis, we review top clips and extract practical signals.
- Identify trends: we track which topics and edits boost engagement and watch time.
- Learn structure: we note common openings, length, and caption patterns that work.
- Adapt, don’t copy: we borrow concepts and remix them to fit our voice and audience.
From these comparisons we document key metrics that predict distribution and channel growth.
We then fold those insights into our production workflow so each experiment is informed by real data.
| What we check | Why it matters | Action |
|---|---|---|
| Top-performing tags & titles | Improves discoverability | Test similar tags and title formats |
| Retention & engagement metrics | Signals content health | Tweak pacing and hooks |
| Thumbnail patterns | Affects click-through rate | Iterate visual style for our brand |
Optimizing Content Strategy with Data Insights
We shape each release around clear signals from our audience so every clip earns more watch time.
Refining hooks and pacing
Refining Hooks and Pacing
We test short openings to see which hook keeps a viewer past the first three seconds.
Small edits in timing often raise retention and improve overall performance. We watch where viewers drop and tighten that moment in the next video.
Using Keyword Research for Search Traffic
Keyword work drives consistent search views to our channel. We pair topic research with past performance to pick ideas that will rank and bring steady discovery.
We also monitor retention data with advanced analytics to spot exact drop points and then refine pacing or hook language.
- Use data to refine hooks every release.
- Pick search-driven topics to build evergreen view sources.
- Adjust pacing where retention falls off.
| Focus | Action | Expected Gain |
|---|---|---|
| Hook | Test 3-second variations | Higher early retention |
| Pacing | Tighten after drop points | Longer average watch time |
| Search | Targeted keywords in title | More steady discovery |
For monetization or distribution checks, we review known issues like revenue sharing problems to avoid surprise interruptions in growth.
Transforming Raw Data into Sustainable Channel Success
Clever measurement makes it simple to repeat wins and fix what drags down performance.
We monitor views, likes, comments, subscribers, and average view duration so every decision is based on clear insights.
By turning complex analytics into a few daily checks, we refine hooks, pacing, and promotion to support steady growth.
We also watch revenue signals and common issues; see our revenue sharing problems guide when payouts or licensing affect results.
Consistent use of these signals helps our videos perform better and keeps our channel valuable for the community long term.